RNS Logo

rns.recipes

◈ 9ce92808be498e9e05590ff27cbfdfe4
RNS 1.5.0 released https://pypi.org/project/rns/ | Nomad: a8d24177d946de4f1f0a0fe1af9a1338

RNS 1.5.0 Testing - Traffic Prioritization & Stability Improvements

Pinned

Started by Mark bc7291552be7a58f... ·

Mark bc7291552be7a58f...
#1

The latest source version of RNS on Aleph has completely reworked inbound traffic processing in the Transport core. By default, RNS now uses four different prioritization levels of packets, which very effectively alleviates increased latency for actual traffic under the insane levels of PR/announces DoS attempts going on lately.

Bad traffic from ingress-limited interfaces are now placed in a low-priority queue, which only drains once higher-priority traffic is done. There's much more detail in the source itself, if you want to have a look, but I'll keep it short here. There's also a long list of various bugfixes.

I'd appreciate any help testing this out before release, it's a pretty big restructuring of how inbound traffic works, so would be good to give it a bit of a spin first.

Also, what the actual ?!? is up with these insane levels of PR/announce spam going on? For example, on one node right now, I'm seeing ~30 clients just connecting and dumping nothing but path requests at around 75 per second. Then there's all the DoS attempts from TOR exit nodes, attempting more or less the same, but mostly just connecting for a few seconds, dumping a couple thousand PRs or announces, and then disconnecting again. I'm not sure if whoever wrote that script missed the fact that they're getting silently blocked. But shhh, don't tell them :P Let em keep playing around, it's great for testing stuff out.

Some of this definitely seems to come from malicious intent, but some of it is also just so weird, that I'm wondering how much of it is just completely broken implementations running wild and doing crazy stuff.

I haven't looked at any of the new matmul-generated "implementations" lately, but I'm wondering if any of them actual have any sort of filtering, de-duplication of announces/PRs, rate-limiting, et cetera, et cetera, or if they're partly responsible for this mess by just passing whatever is handed to them happily to the entire network.


Mark bc7291552be7a58f...
#2

Also, this lays the groundwork for fully customizable traffic prioritization and QoS functionality, so certain traffic can go to a real-time queue, and so on. That won't be in the next release though, let's get the foundations well tested and optimized first.

Anonymous
#3

DoS? Who sees rns as the enemy?

qbit b253938bf730967b...
#4

Updated my main nodes. Things seem stable. Watchin the queue pressure meow.

K8 8e4525cda4482720...
edited #5

This looks great, awesome work! I'll do what I can to test this out. I have been having a hell of a time keeping rns.kin.earth stable recently, even with very aggressive ingress limiting for announces and PRs (and egress limiting to not pass any bullshit downstream). It's not like it's been particularly stable to begin with so I'm inclined to just throw this release up there and see how it goes.

The node does ok for a while (maybe for a few days to a week) but then I start seeing RNS peg a core to 100% and hang (unrelated to discovery stamps). Packets stop making it through, links have issues establishing, and even rnstatus can hang for 10-60s at times. I really have no idea the root cause at this point. I just restart RNS when things start having issues and it works ok for a few more days. The behavior kind of pattern matches to getting stuck spending too much time in garbage collection but I haven't verified (I was going to experiment by having Transport._jobs() run garbage collection less frequently instead of every 0.25s, or maybe having it decide when to GC based on the fraction of the period that _jobs() actually spent doing work or something like that). This is all on a 4-core VPS with 8GB RAM and fast network.

I think part of it is possibly that I have a high stamp value, which puts me at or near the top of the list for auto-connection. A result of that, as far as I can tell, is that a ton of transport nodes out there auto-connect to my node. One of the patterns I've observed is the node getting pummeled by duplicate path requests (sometimes 50+) all at once, whenever a path request happens on the network. Filtering dupes is normal behavior but the extent of it was pretty extreme, and points to the node being over-connected (aka a nexus of bullshit 😂).

Inbound/outbound queues with prioritization should help a lot. I'm working on collecting more in-depth statistics from the instance to see if I can spot any other patterns.

Edit: looking good so far.

p1ld7a b2e101f8b8d8c776...
#6

@K8: Sharing the same issue with 1.4.2. After a while, the service stop working.

Here's the last one:

aoû 18 07:15:06 apollo systemd[1]: rnsd.service: Main process exited, code=exited, status=255/EXCEPTION
aoû 18 07:15:06 apollo systemd[1]: rnsd.service: Failed with result 'exit-code'.
aoû 18 07:15:06 apollo systemd[1]: rnsd.service: Consumed 3min 14.919s CPU time over 11min 36.317s wall clock time, 223.4M memory peak, 69M read from disk, 28.8M written to disk, 29.3M incoming IP traffic, 28.2M outgoing IP traffic.

I won't be able to test 1.5.0 sadly, but I hope it will fix this.

bergie f9477df559d52317...
edited #7

Mark wrote:

I haven't looked at any of the new matmul-generated "implementations" lately, but I'm wondering if any of them actual have any sort of filtering, de-duplication of announces/PRs, rate-limiting, et cetera, et cetera, or if they're partly responsible for this mess by just passing whatever is handed to them happily to the entire network.

So, I checked. Since reticulum-js is currently leaf node only (no transport capability), we're not retransmitting announces or path requests.

However, since we probably want to have transport: true in the future, I'll try to make sure we handle these things as close to Python as is reasonable (given difference in event model, programming language, etc).

De-duplication of announces is already in place, and the max announce rate allowed is once per minute (30min default, though this is JS and such limits can be overridden). What's missing is at least rate limiting. I'll also see what we can do to ensure JS apps can't accidentally spam path requests etc.

Mark bc7291552be7a58f...
#8

Pushed some more tweaks for this. Queue sizes are now configurable with:

[reticulum]
  qlen_in_data = 4096
  qlen_in_announce = 256
  qlen_in_pr = 256
  qlen_in_il = 128

Also tuned the defaults, the previous one were unnecessarily large. You can most likely drop the IL queue even further, running it at 48 pkts right now, and seems to be a good spot for my particular node.

K8 8e4525cda4482720...
#9

I've been running on 503bd6c8 for about 10 hours. Right now I have around 200 clients, and I'm having a hard time actually using the node. Can't even browse Nomad sites that are hosted on the same machine. Queue stats:

 Totals       : ↑3.45 GB  201.76 Kbps
                ↓3.14 GB  293.58 Kbps

 Qu. Pressure : 0.4% total, 19 pkts, 12341 dropped
                0.0% data, 0 pkts
                0.0% announce, 9 pkts, 1386 dropped
                0.0% path request, 1 pkts
                7.0% ingress limiter, 9 pkts, 10955 dropped

The dropped counts don't seem to be raising particularly quickly right now. Node has the same symptoms I described above with constant high CPU usage by RNS on one core, and rnstatus is back to taking ~20s to print anything, so the queues don't seem to be helping with whatever is causing all that. Logs are completely full of path requests as usual.

#10

Have you noticed anything else about the patterns? Like time of day, or the window of time they're connecting for? And are the PRs/announces you're seeing all for the same destination(s), or varied?

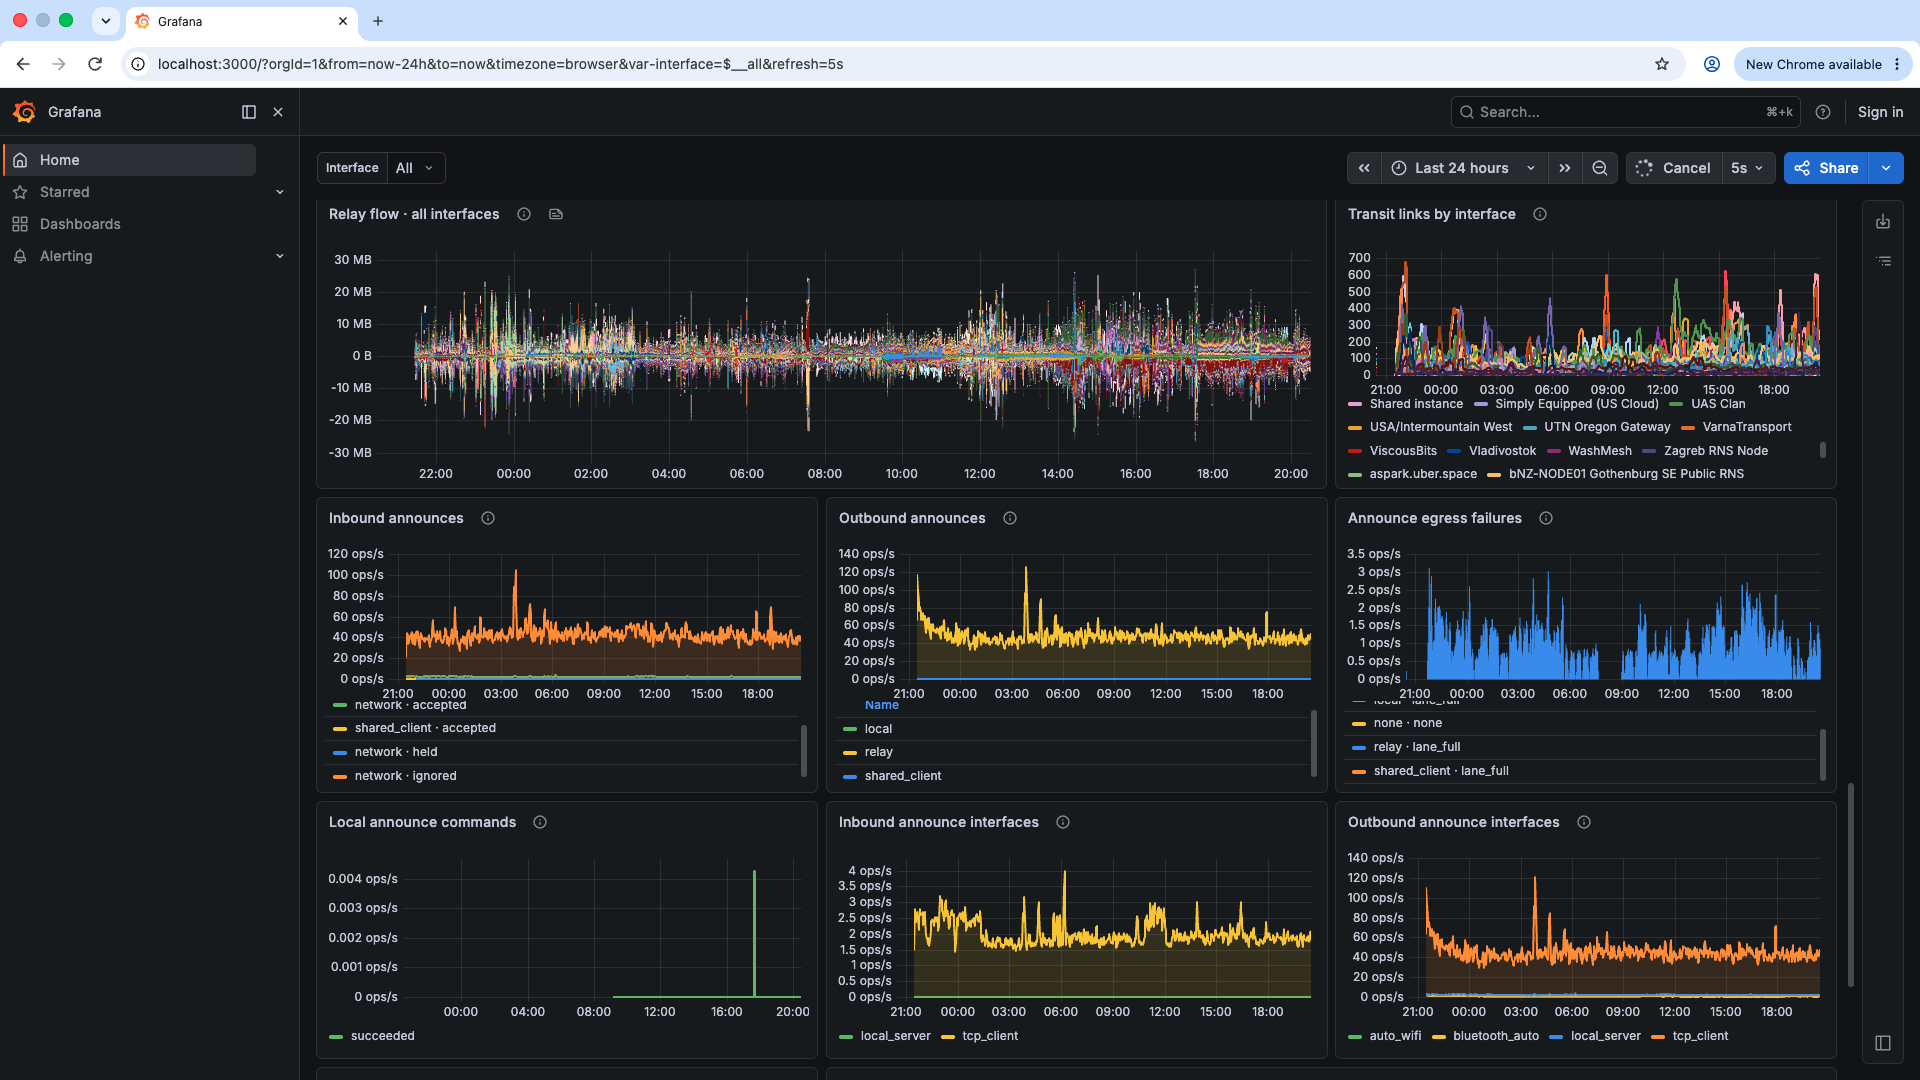
Just asking cuz that might help me dig for specifics. But in the aggregate I haven't seen any sign of that. Currently connected to ~60 public nodes as a transport node to stress test and look for this kind of stuff, and while the data flow fluctuates a lot like you'd expect, and the link counts fluctuate a lot, the inbound announce flow is pretty steady and doesn't show signs of that. Even over a 24 hour period it's mostly a steady flow with a large number of expected-ignored ones
image.png
(also just in case anyone's concerned, the seemingly-large number of outbound announces here is just because this is total announces on all interfaces. Each accepted inbound announce from an interface relays out across the rest)

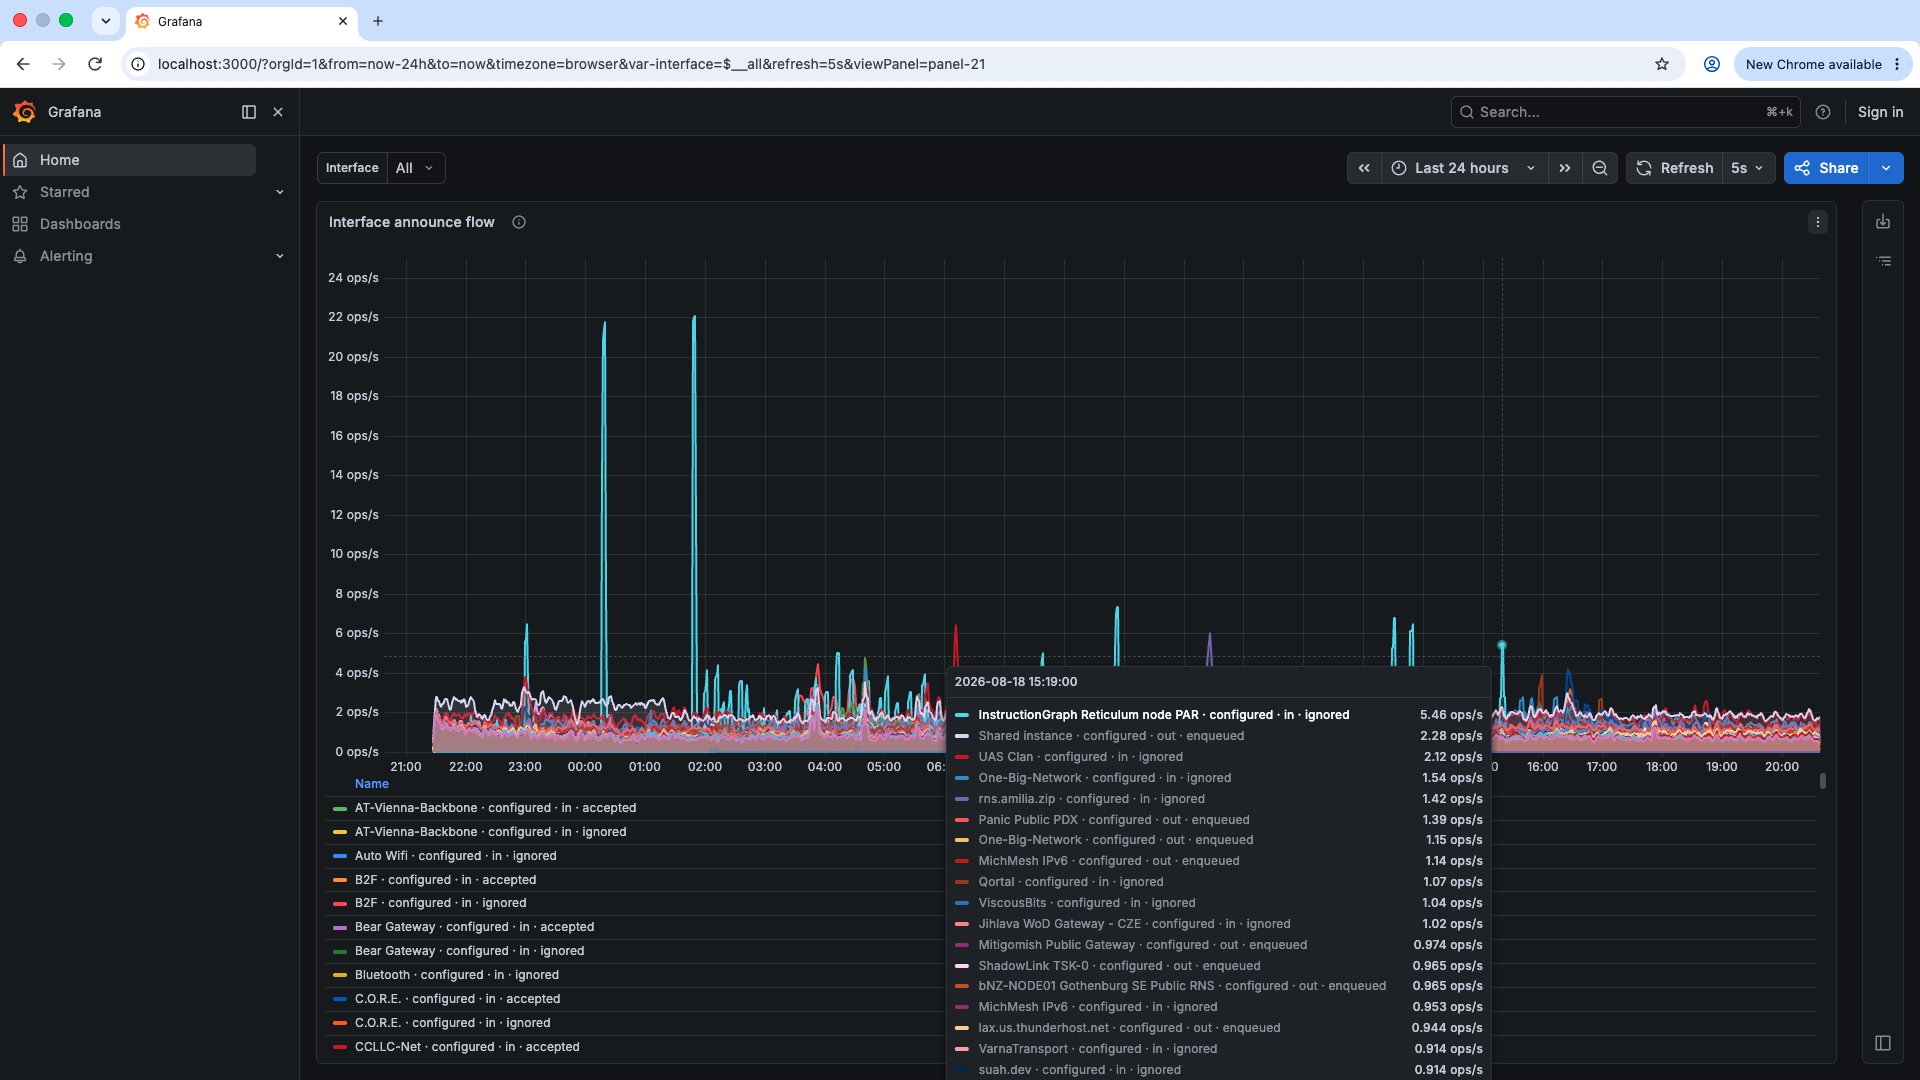
There's one specific interface that had a few spikes compared to the pack, but even then they're extremely brief and only about 20/s during that small window. Doesn't quite seem to fit.
image.png

Of course, I can't see what kind of traffic those public nodes are getting directly. And it might be something only happening directly (like your experience, direct connection + immediate spam). But it seems these public nodes are, at least, indeed properly filtering any excess bursts before passing qualified traffic along.

weird_bleks c980faae8519d898...
#11

I've had the same experience as @K8. I've updated my public node to test it and about 12h ago(after running for close to 10h) i've had connectivity issues. Not sure if it's related but i suspect it is.

Most nomad pages failed to establish link. Some worked suprisingly, but most didn't.

One particularity i observed was when i tried to connect to rns.recipes via Columba, that the request failed again and again but i didn't receive a new announce/path, it was still showing '4h ago'.
This makes me think the path request was blocked somehow, and it never got back to me. This aligns with the latest changes, and i think somewhere a queue was full so my PRs never got accepted.

Maybe this happened when the network was being spammed like Mark said, maybe not, who knows. It did happen with the default settings after Mark decreased the sizes, so there's that, maybe i should have used higher values for queues.

Unfortunately i didn't actually debug, just observed passively. After restarting the node it worked better.

Mark bc7291552be7a58f...
#12

Thanks for the testing and feedback everyone!

I just pushed another round of fixes and improvements to Aleph, latest on master now. There was a few mistakes relating to PR processing, and a range of other bugs fixed as well. I think some of the core pegging might have stemmed from a stupid bug in the way pending PRs were processed, and that's fixed now.

@K8 (and others), can you try the latest version (and also try dropping loglevel below LOG_PATHING)? Under insane announce/PR loads, logging all of that is going to have a significant performance hit, especially on IOPS constrained servers. I recently refactored all the logging so LOG_DEBUG should now be sufficient for mostly everything, unless you actually want to see all that path/announce log spam.

#13

Dug into it some more, findings might be helpful.

Saw a notable, short-term burst after all. It was evenly spread across most of these public nodes, but struck me as odd that there'd be a unified burst like that.

Kept looking and saw that right around that same time, one of the public nodes flapped. Also noted about 70% of the destinations are for "lxmf.delivery" and "lxst.telephony", (~~50% the former, ~~20% the latter).

It starts to make a bit more sense looking at Sideband on android. The default-on start_announce config setting means it will re-announce on all interfaces after one drops. Also, when an interface comes back up, it re-announces again. The rate limiting there looks like just a single 3.5s cooldown kind of thing.

So it looks highly plausible that what's happening is as follows:

Android Sideband apps are connected to a public tcp/backbone server. Often a few of them.

Then, one of the public nodes flaps, for whatever reason.

When it goes down, all those android Sideband instances re-announce on all interfaces, including those other public nodes. Genuine, fresh announces which is why they're also forwarded.

After that, ~5s later, when their interfacce to the flapped node reconnects, it fires an announce on all interfaces again. The reconnect period is longer than those reactive announces' 3.5s cooldown, so this would happen pretty reliably.

In fact, if that same flapping public node was itself a client to one of your nodes, then the behavior makes a lot of sense with what you experienced: If that other public node flapped for reasons that take that client interface offline for a blip as well (seems likely), then it would be reconnecting to your node around the same time as all the android Sideband users reconnect to it, and it forwards those once-again-fresh-legitimate-announces.

So for each user, a flap can trigger up to 4 announces per user it happens to. There are the 2 destinations of lmxf.delivery and sometimes lxst.telephony, with the 2nd wave occasionally getting eaten by the 3.5s cooldown, just depending on where exactly the timing windows land.

Since these are categorically already known destinations by the time all this happens, the rush doesn't enter the burst ingress jail. It's only subject to the 2% limit. Considering the flaps don't happen super often, the recently-added defaults wouldn't likely stop it either, since it's a 5 announce grace on the per-hour limit of announces per destination. Even the TCP default bitrate guess of 10Mbps would allow for ~100 transportd announces/second. It would only take like 40-70 android SB users on the other side of the public node to feel this. Very reasonable that's already happening

Also, a lot of the steady baseline announce flow was app data like this {"v":1,"n":"Maps","c":0}, meshchatx's map pack beacon thing. It's on by default for all users and fires one every 15 minutes, even for users with no map packs published. But a recent commit is changing that setting to be off by default and to not do the announce unless at least 1 map is published, so that's apparently coming down the pipeline and should help too.

Anyway, haven't narrowed down the path requests as much, but considering a lot of active Links could be open on those same interfaces when the flap happens, there's a good chance that's related, too. The burst I saw also showed a burst of PRs shortly before the announces, which lines up.

Mark bc7291552be7a58f...
#14

Thanks for looking into it Ken, but it's not so much the announce waves happenning as clients reconnect that I find weird. Those make pretty decent sense, and it's usually just one or two announces per sub-interface. They do tend to come in a wave, but usually only around a couple of hundred at a time, not really a problem.

And active links that go down wouldn't cause new path requests when they drop, not in RNS at least. It's only attempted links that were pending but never established (and only at the initiator and penultimate hop that would occur, not in any way over the entire path) that trigger a path request under some conditions.

The thing I find weird is more the clients that are connecting, and then pumping out path requests or announces at rates between 10 to 100 Hz, often sustained for 5-30 seconds. Some of these clients connect for exactly 5 seconds (with a jitter of only ~5-15ms), and start spamming as soon as they're connected, then disconnect (presumably to rotate IPs). Most of that kind of "traffic" comes from TOR exit nodes.

Another class of them stay connected, and will wait for varying intervals until they start dumping. They then dump their (primarily PR) spam for destinations that has never existed on the network, keep it up for 10-30 seconds, go silent again and wait until the next cycle.

Sometimes it coincides with several clients doing it at the same time, which can easily compound into 10k+ path requests being received in around 30 seconds.

#15

Mark wrote:

Thanks for looking into it Ken, but it's not so much the announce waves happenning as clients reconnect that I find weird. Those make pretty decent sense, and it's usually just one or two announces per sub-interface. They do tend to come in a wave, but usually only around a couple of hundred at a time, not really a problem.

And active links that go down wouldn't cause new path requests when they drop, not in RNS at least. It's only attempted links that were pending but never established (and only at the initiator and penultimate hop that would occur, not in any way over the entire path) that trigger a path request under some conditions.

The thing I find weird is more the clients that are connecting, and then pumping out path requests or announces at rates between 10 to 100 Hz, often sustained for 5-30 seconds. Some of these clients connect for exactly 5 seconds (with a jitter of only ~5-15ms), and start spamming as soon as they're connected, then disconnect (presumably to rotate IPs). Most of that kind of "traffic" comes from TOR exit nodes.

Another class of them stay connected, and will wait for varying intervals until they start dumping. They then dump their (primarily PR) spam for destinations that has never existed on the network, keep it up for 10-30 seconds, go silent again and wait until the next cycle.

Sometimes it coincides with several clients doing it at the same time, which can easily compound into 10k+ path requests being received in around 30 seconds.

Oh right sorry to clarify, I mean in LXMF, the rtt x 6 timeout. Assuming for these kinds of links that's like 0.5-2s. With maybe a few seconds of delay from the polling timing. But anyway, yeah what you're describing definitely sounds like it's a different breed. Will keep an eye on that pattern going forward. For now at the very least it's one small lil data point that I'm currently not seeing any sign of that traffic pattern from my position.

Thanks!

#16

Actually, might've spoken too soon; gonna dig in more on specifically looking for the volume of destinations that i've not heard an announce for myself and work backward from there. If anything fruitful comes of it I'll share with ya

K8 8e4525cda4482720...
edited #17

Mark wrote:

Thanks for the testing and feedback everyone!

I just pushed another round of fixes and improvements to Aleph, latest on master now. There was a few mistakes relating to PR processing, and a range of other bugs fixed as well. I think some of the core pegging might have stemmed from a stupid bug in the way pending PRs were processed, and that's fixed now.

@K8 (and others), can you try the latest version (and also try dropping loglevel below LOG_PATHING)? Under insane announce/PR loads, logging all of that is going to have a significant performance hit, especially on IOPS constrained servers. I recently refactored all the logging so LOG_DEBUG should now be sufficient for mostly everything, unless you actually want to see all that path/announce log spam.

Cool, I'm deployed up to the latest HEAD now, we'll see how it goes. I sent you a patch to move logging into its own thread, that should help some with that issue (previously it was also reopening and closing the logfile on every single log write, that certainly wasn't helping anything either). I've thought about the logging perf before, but my server has NVMe backed storage that I've tested to be plenty fast so I don't think that is the issue I'm seeing. I've still reduced the log level for now to see if it helps. So far it doesn't seem to have changed the CPU usage patterns at all.

More stats from the last version I deployed:

 Totals       : ↑11.30 GB  1.51 Mbps
                ↓9.99 GB   1.01 Mbps

 Qu. Pressure : 0.0% total, 0 pkts, 85120 dropped
                0.0% data, 0 pkts
                0.0% announce, 0 pkts, 40479 dropped
                0.0% path request, 0 pkts, 290 dropped
                0.0% ingress limiter, 0 pkts, 44351 dropped

 Uptime is 20h, 49m and 56.32s, 573 entries in link table
Mark bc7291552be7a58f...
#18

Thanks for the patch @K8, got it fetched locally here. I'll look at that after 1.5.0 is out, there's already plenty of new stuff for this one. To be honest, I'm a bit on the fence about adding the buffering and and non-blocking log writes. Call it a work-related injury, but I don't like log-files that lag ;) But let's see what we can do to improve it.

Yeah, if it's a physical server it shouldn't be much of a problem, but on some VPSes on shared storage backend, all the individual, short and small file open/write/flush ops can bog things down.

If you're on the latest source version, running "vanilla" with no local patches, it's very odd that the sustained CPU spikes are still there. I'd really love to know what on earth is causing that. Not seeing anything like it here on any of my nodes anymore. It is the rnsd process itself doing it, right? Not some other RNS program?

If it's completely opaque, it might be worth adding a sprinkling of with RNS.Profiler: contexts to various parts of Transport.py to capture a profiling trace and guage where things are going wonky.

K8 8e4525cda4482720...
#19

Fair enough about log buffering! I have it set up to notify the writer thread using more or less the same kind of structure as the new inbound queues, and I have the file buffering mode set to flush after every line, so in most cases it should be pretty responsive. But I'm sure there's a middle ground solution to be found. At the very least there are some more edge cases to handle like making sure that the log queue is fully flushed before exiting.

Yup, just the rnsd process. Speaking of the Profiler, I just spent part of the day reworking it so that it's possible to get live results through rnstatus, which is way way more usable when trying to profile a big running node like this where the problems don't usually start early on. It's still a bit shit and bogs down the node when processing a ton of samples, so take these numbers (especially the maximums) with a grain of salt:

K8 8e4525cda4482720...
#20
 Profiling    :
   Transport._inbound
     Samples  : 1000000
     Total    : 696s 647ms 188.38µs
                      Mean      |     Median     |      Min       |      Max       |    St. dev
     Stats    : (   696.65µs    |    381.61µs    |    11.09µs     | 940ms 672.49µs |  7ms 175.09µs )
        1m    : (   716.2µs     |    362.31µs    |     14.6µs     | 870ms 693.37µs |  8ms 878.46µs )
        5m    : (   691.25µs    |    373.71µs    |     14.6µs     | 884ms 220.88µs |  8ms 735.54µs )
       30m    : (   718.95µs    |    381.5µs     |    11.09µs     | 940ms 672.49µs |  8ms 418.49µs )

   Transport._inbound.0qget
     Samples  : 1000000
     Total    : 2467s 848ms 6.58µs
                      Mean      |     Median     |      Min       |      Max       |    St. dev
     Stats    : ( 2ms 467.85µs  |     9.84µs     |     1.31µs     | 1s 66ms 644.86µs | 14ms 587.09µs )
        1m    : ( 1ms 710.88µs  |     5.99µs     |     1.42µs     | 894ms 199.92µs | 15ms 219.51µs )
        5m    : ( 2ms 77.09µs   |     7.15µs     |     1.42µs     | 894ms 199.92µs | 16ms 111.42µs )
       30m    : ( 2ms 547.86µs  |     9.58µs     |     1.31µs     | 992ms 174.0µs  | 16ms 830.31µs )

   Transport._inbound.0qput
     Samples  : 1000064
     Total    : 18s 481ms 312.09µs
                      Mean      |     Median     |      Min       |      Max       |    St. dev
     Stats    : (   18.48µs     |    13.08µs     |     1.28µs     |  80ms 85.21µs  |    185.64µs   )
        1m    : (   33.14µs     |     7.77µs     |     1.36µs     | 31ms 200.31µs  |    542.1µs    )
        5m    : (   20.51µs     |     9.6µs      |     1.36µs     | 31ms 200.31µs  |    283.69µs   )
       30m    : (   18.87µs     |    12.95µs     |     1.28µs     |  80ms 85.21µs  |    199.28µs   )

   Transport._inbound.1preamble
     Samples  : 1000000
     Total    : 12s 72ms 308.7µs
                      Mean      |     Median     |      Min       |      Max       |    St. dev
     Stats    : (   12.07µs     |    10.26µs     |     2.23µs     | 26ms 467.84µs  |    35.06µs    )
        1m    : (   10.14µs     |     7.94µs     |     2.23µs     |  5ms 276.61µs  |    31.41µs    )
        5m    : (   10.82µs     |     8.97µs     |     2.23µs     |  5ms 276.61µs  |    18.34µs    )
       30m    : (   12.01µs     |    10.24µs     |     2.23µs     |  9ms 16.73µs   |    21.21µs    )

   Transport._inbound.2broadcast
     Samples  : 1000000
     Total    : 1s 769ms 213.77µs
                      Mean      |     Median     |      Min       |      Max       |    St. dev
     Stats    : (    1.77µs     |     1.48µs     |     0.51µs     |  8ms 963.64µs  |    14.58µs    )
        1m    : (    1.51µs     |     1.25µs     |     0.54µs     |    111.46µs    |     2.32µs    )
        5m    : (    1.62µs     |     1.37µs     |     0.54µs     |    666.38µs    |     3.59µs    )
       30m    : (    1.8µs      |     1.49µs     |     0.51µs     |  8ms 963.64µs  |    19.05µs    )

   Transport._inbound.3routing
     Samples  : 1000000
     Total    : 356s 111ms 111.75µs
                      Mean      |     Median     |      Min       |      Max       |    St. dev
     Stats    : (   356.11µs    |    252.79µs    |     0.84µs     | 847ms 270.25µs |   3ms 31.4µs  )
        1m    : (   427.17µs    |    246.73µs    |     0.85µs     | 763ms 679.62µs |  5ms 979.5µs  )
        5m    : (   379.65µs    |    267.45µs    |     0.85µs     | 763ms 679.62µs |  4ms 596.7µs  )
       30m    : (   342.67µs    |    221.09µs    |     0.85µs     | 847ms 270.25µs |  3ms 352.37µs )

   Transport._inbound.4announce
     Samples  : 191543
     Total    : 159s 10ms 113.93µs
                      Mean      |     Median     |      Min       |      Max       |    St. dev
     Stats    : (   830.15µs    |    370.23µs    |     1.03µs     | 1s 6ms 391.2µs | 10ms 522.28µs )
        1m    : ( 2ms 566.51µs  |    349.36µs    |    179.35µs    | 1s 6ms 391.2µs | 28ms 595.39µs )
        5m    : ( 1ms 524.79µs  |    358.61µs    |    179.35µs    | 1s 6ms 391.2µs | 20ms 627.92µs )
       30m    : (   960.59µs    |    376.37µs    |    179.31µs    | 1s 6ms 391.2µs |  13ms 753.1µs )
       60m    : (   846.51µs    |    369.09µs    |     5.64µs     | 1s 6ms 391.2µs | 10ms 910.17µs )

   Transport._inbound.5linkreq
     Samples  : 139
     Total    : 656.32µs
                      Mean      |     Median     |      Min       |      Max       |    St. dev
     Stats    : (    4.72µs     |     4.16µs     |     2.26µs     |    39.11µs     |     3.61µs    )

   Transport._inbound.6localdata
     Samples  : 1000000
     Total    : 215s 707ms 890.47µs
                      Mean      |     Median     |      Min       |      Max       |    St. dev
     Stats    : (   215.71µs    |     3.47µs     |     0.8µs      | 989ms 968.77µs |  5ms 657.0µs  )
        1m    : (   745.63µs    |     2.83µs     |     0.87µs     | 989ms 968.77µs | 11ms 821.01µs )
        5m    : (   379.16µs    |     3.16µs     |     0.87µs     | 989ms 968.77µs |  8ms 654.97µs )
       30m    : (   292.53µs    |     3.52µs     |     0.87µs     | 989ms 968.77µs |  7ms 393.89µs )
       60m    : (   220.61µs    |     3.47µs     |     0.87µs     | 989ms 968.77µs |  5ms 766.42µs )

   Transport._inbound.7proofs
     Samples  : 15031
     Total    : 8s 489ms 946.9µs
                      Mean      |     Median     |      Min       |      Max       |    St. dev
     Stats    : (   564.83µs    |    534.0µs     |     1.09µs     | 402ms 697.03µs |  3ms 379.42µs )
        1m    : (   483.94µs    |    438.67µs    |     1.44µs     | 14ms 398.25µs  |    808.8µs    )
        5m    : (   518.79µs    |    505.57µs    |     1.44µs     | 14ms 398.25µs  |    655.32µs   )
       30m    : (   564.51µs    |    545.23µs    |     1.3µs      |  38ms 306.9µs  |    780.41µs   )
       60m    : (   567.58µs    |    535.1µs     |     1.09µs     | 402ms 697.03µs |  3ms 473.32µs )

   Transport._outbound
     Samples  : 480707
     Total    : 378s 887ms 972.18µs
                      Mean      |     Median     |      Min       |      Max       |    St. dev
     Stats    : (   788.19µs    |    198.96µs    |     8.4µs      | 3s 894ms 165.77µs |  12ms 22.41µs )
        1m    : ( 4ms 821.53µs  |    208.63µs    |    34.94µs     | 2s 440ms 169.09µs | 57ms 900.53µs )
        5m    : ( 2ms 242.8µs   |    207.01µs    |    30.96µs     | 3s 894ms 165.77µs | 22ms 632.99µs )
       30m    : ( 1ms 83.75µs   |    205.03µs    |    30.96µs     | 3s 894ms 165.77µs | 14ms 789.18µs )
       60m    : (   800.34µs    |    199.09µs    |     8.4µs      | 3s 894ms 165.77µs | 12ms 149.74µs )

   Transport.jobs
     Samples  : 14014
     Total    : 493s 468ms 695.57µs
                      Mean      |     Median     |      Min       |      Max       |    St. dev
     Stats    : (35ms 212.55µs  |    44.41µs     |    14.11µs     | 1s 781ms 862.98µs | 148ms 344.6µs )
        1m    : (73ms 288.13µs  |     43.7µs     |    15.73µs     | 1s 781ms 862.98µs | 257ms 256.36µs)
        5m    : ( 61ms 75.99µs  |    41.55µs     |    14.81µs     | 1s 781ms 862.98µs | 226ms 485.52µs)
       30m    : (50ms 433.39µs  |    43.63µs     |    14.11µs     | 1s 781ms 862.98µs | 193ms 717.94µs)
       60m    : (37ms 646.16µs  |    43.82µs     |    14.11µs     | 1s 781ms 862.98µs | 154ms 789.88µs)

   Transport.jobs.gc
     Samples  : 759
     Total    : 371s 241ms 487.19µs
                      Mean      |     Median     |      Min       |      Max       |    St. dev
     Stats    : (489ms 119.22µs | 576ms 382.83µs | 35ms 737.43µs  | 1s 78ms 71.96µs | 240ms 796.72µs)
        1m    : (820ms 979.27µs | 807ms 622.03µs | 685ms 695.3µs  | 1s 78ms 71.96µs |  93ms 50.71µs )
        5m    : (776ms 645.01µs | 755ms 954.83µs | 631ms 438.14µs | 1s 78ms 71.96µs | 77ms 317.52µs )
       30m    : (700ms 853.22µs | 695ms 284.06µs | 545ms 27.43µs  | 1s 78ms 71.96µs | 76ms 137.25µs )
       60m    : (524ms 311.13µs | 605ms 417.47µs | 92ms 458.45µs  | 1s 78ms 71.96µs | 216ms 533.47µs)

   Transport.preprocess_inbound
     Samples  : 1000113
     Total    : 602s 916ms 166.08µs
                      Mean      |     Median     |      Min       |      Max       |    St. dev
     Stats    : (   602.85µs    |    403.73µs    |     0.79µs     | 1s 105ms 270.83µs |  3ms 959.36µs )
        1m    : ( 1ms 207.85µs  |    386.93µs    |     0.82µs     | 1s 105ms 270.83µs | 11ms 616.07µs )
        5m    : (   837.96µs    |    397.57µs    |     0.81µs     | 1s 105ms 270.83µs |  7ms 457.0µs  )
       30m    : (   642.77µs    |    405.44µs    |     0.79µs     | 1s 105ms 270.83µs |  4ms 638.01µs )

   Transport.transmit
     Samples  : 1952690
     Total    : 557s 122ms 313.25µs
                      Mean      |     Median     |      Min       |      Max       |    St. dev
     Stats    : (   285.31µs    |    206.69µs    |     0.62µs     | 851ms 483.43µs |  2ms 697.23µs )
        1m    : (   244.3µs     |    201.96µs    |     0.62µs     | 851ms 483.43µs |  2ms 168.61µs )
        5m    : (   252.74µs    |    202.99µs    |     0.62µs     | 851ms 483.43µs |  2ms 430.83µs )
       30m    : (   273.97µs    |    203.25µs    |     0.62µs     | 851ms 483.43µs |  2ms 652.99µs )
       60m    : (   285.32µs    |    206.7µs     |     0.62µs     | 851ms 483.43µs |  2ms 697.33µs )

Post a Reply

Supports Markdown: **bold**, *italic*, `code`, ```code blocks```, [links](url)

Log in to upload images

Quote
Copied to clipboard