RNS Logo

rns.recipes

◈ 9ce92808be498e9e05590ff27cbfdfe4
RNS 1.5.0 released https://pypi.org/project/rns/ | Nomad: a8d24177d946de4f1f0a0fe1af9a1338

RNS 1.5.0 Testing - Traffic Prioritization & Stability Improvements

Pinned

Started by Mark bc7291552be7a58f... ·

Mark bc7291552be7a58f...
#21

Wow, that is a gift from heaven @K8 :) Very nice! Been wanting something like that forever, but just couldn't muster the will to get it done ;) It would be awesome to get this merged in as well. Please do let me know when you feel it's ready for review. Is it on your git node already? Would love to try it out.

And yeah, I do agree with the logging being better as non-blocking in almost all cases. We can probably use your patch more or less as is. Maybe I can just add a blocking mode switch or something for the paranoid :)

K8 8e4525cda4482720...
edited #22

It's on the live_profiling branch! This was fueled by equal parts frustration and obsession so there's still plenty of work to do to make it nice and fast. I'm still resisting the urge to bring in numpy as an optional dependency...

Mark bc7291552be7a58f...
#23

No numpy! Take it as a challenge! lol :) Thanks! Gonna have a play with that :)

K8 8e4525cda4482720...
#24

More stats with the much improved live profiling: https://pastebin.com/PmUuUhnW

Check out the 1-3s spikes in _outbound()! All the interfaces on this node are Backbones (plus one thing on the shared instance, which should also be using epoll), so IO shouldn't be blocking. Barring the entire server just stalling out (which I would expect to see some sign of in other places, not just in _outbound()), and given the other things that the function does, this seems to leave lock contention as the likely culprit. Also notice that jobs() has spikes of nearly 1s, and as I've been watching these stats over time, I consistently notice that jobs() (as well as the GC that it sometimes runs) takes more and more time to complete the longer the node has been running. Jobs takes out a lot of big locks, and if it holds them for a long time, it could cause stalls in many other locations throughout Transport.

I know I was going on about this a while back, and the new inbound queues can enable a lot of improvements, but there is some low hanging fruit that could help improve things. For example, every instance of this pattern (example from _outbound()):

            with Transport.path_table_lock:
                if not packet.destination_hash in Transport.path_table:
                    RNS.log(f"Dropped packet since path table entry disappeared during outbound processing", RNS.LOG_WARNING)
                    return False
                else: path_entry = Transport.path_table[packet.destination_hash]
            
             # ... work with path_entry outside the lock ...

Can be replaced with this:

            path_entry = Transport.path_table.get(packet.destination_hash)
            if path_entry is None:
                RNS.log(f"Dropped packet since path table entry disappeared during outbound processing", RNS.LOG_WARNING)
                return False

            # ... work with path_entry ...

dict.get(...) is atomic with the GIL, and both lock-free and atomic with free-threading, so you don't need to hold path_table_lock. Can't necessarily do it in every instance, depending on what else needs to happen with what you get from the dict, but there are many cases where it's totally fine (and, at the very least, equivalent to the locking logic that's already there, just without the lock).

Mark bc7291552be7a58f...
#25

Thanks K8, yeah that one is definitely an obvious contender :) I changed that one now, but the full trawling through everything I'll start looking at after 1.5.0 is out. There's enough changes already, so right now I'm wrapping that one up and getting it out. Once it is, I'll merge in your live profiling patches, and start looking at those improvements in a more focused manner.

Thanks for the feedback and testing everyone!

edited #26

Hi,

don't know if it is intentional, but rnprobe in version 1.5.0 does not show RSSI and SNR.

Tested on same client host with LoRa as the only interface and RNS in separated python virtual environments. Destination is transport node version 1.5.0.

$ rnprobe --version

rnprobe 1.5.0

$ rnprobe rnstransport.probe 1ba5....

Sent probe 1 (16 bytes) to <1ba5....>
Valid reply from <1ba5....>
Round-trip time is 696.223 milliseconds over 1 hop [Link Quality 100.0%]

Sent 1, received 1, packet loss 0.0%

$ rnprobe --version

rnprobe 1.4.2

$ rnprobe rnstransport.probe 1ba5....

Sent probe 1 (16 bytes) to <1ba5....>
Valid reply from <1ba5....>
Round-trip time is 618.224 milliseconds over 1 hop [RSSI -63 dBm] [SNR 10.0 dB] [Link Quality 100.0%]

Sent 1, received 1, packet loss 0.0%

Edit: formatting

Mark bc7291552be7a58f...
#27

Thanks @RaspiSpoon, that's definitely not intentional. I'll look into it.

@K8, I think I might have found the cause of your CPU spikes. You're running IFAC on the public interface of your transport node, right? Well, I knew that the IFAC implementation was slow - I never really designed it with high throughput in mind, but as an extremely bandwidth efficient and entirely passive authentication system, waaay back. But, I hadn't really looked at how slow it actually was compared to the rest of RNS at this point. Turns out I had a couple of O(n2) party crashers in that, so we were running at quadratic complexity, which massively hurts on high-MTU packets, like most backbone interfaces use now.

I optimized it. It's now around 90x faster, lol :) Source is on Aleph if you want to try it out.

K8 8e4525cda4482720...
#28

That's great, I'll give it a try. Thanks! I was wondering about that too and already added some profiling to check yesterday. It was actually not as bad as I was expecting, though all optimization helps. I'll post up some more stats tomorrow. It also looks like the path_table_lock in _outbound was maybe also not the culprit (I missed it before, but there's another path_table_lock in next_hop_interface which doesn't seem to be taking much time at all. I see two other big sources of spikes in outbound handling.

First is creating the Timer thread for queued announces. Averages low but spikes very high, and it can happen in a loop for every interface. Granted that particular branch doesn't run all that often.

Second is pretty much the entire branch for broadcasting on all interfaces. I was able to trace the spikes down through transmit and to BackboneInterface.tx_ready which is really only doing epoll.modify. It would just take a few interfaces seeing a spike to add up to the bigger spikes in _outbound. I'm not sure what to make of that epoll call being sometimes slow.

Anyways I sent you a message about some more improvements to live profiling that I pushed.

Anonymous
#29

Mark wrote:

Thanks @RaspiSpoon, that's definitely not intentional. I'll look into it.

@K8, I think I might have found the cause of your CPU spikes. You're running IFAC on the public interface of your transport node, right? Well, I knew that the IFAC implementation was slow - I never really designed it with high throughput in mind, but as an extremely bandwidth efficient and entirely passive authentication system, waaay back. But, I hadn't really looked at how slow it actually was compared to the rest of RNS at this point. Turns out I had a couple of O(n2) party crashers in that, so we were running at quadratic complexity, which massively hurts on high-MTU packets, like most backbone interfaces use now.

I optimized it. It's now around 90x faster, lol :) Source is on Aleph if you want to try it out.

Wow! That's impressive.

Is it possible to see the average MTU or similar for an interface?

p1ld7a b2e101f8b8d8c776...
edited #30

Hello,

I have been testing version 1.5.0 on my public node recently. After a few days, I can say that the issue I had with 1.4.2 is still present.

For some reason, the daemon stop working, here's the log of my Apollo RNS node:

❯ sudo systemctl status rnsd.service
× rnsd.service - Reticulum Network Stack Daemon
     Loaded: loaded (/etc/systemd/system/rnsd.service; enabled; preset: ignored)
     Active: failed (Result: exit-code) since Mon 2026-08-24 06:23:04 CEST; 3h 51min ago
   Duration: 1d 9h 24min 3.221s
 Invocation: 6fad41208f42476e9358f1c97f781885
    Process: 121784 ExecStartPre=/nix/store/3746cb7f5j9apgmgnj7735w5dczwnyh8-unit-script-rnsd-pre-start/bin/rnsd-pre-start (code=exited, status=0/SUCCESS)
    Process: 121798 ExecStart=/nix/store/hwk2777va14slqqlcj9b0y6217r418vf-python3.14-rns-1.5.0/bin/rnsd --config $STATE_DIRECTORY (code=exited, status=255/EXCEPTION)
   Main PID: 121798 (code=exited, status=255/EXCEPTION)
         IP: 4.7G in, 5.4G out
         IO: 700K read, 2.3G written
   Mem peak: 405.6M
        CPU: 4h 59min 8.631s

aoû 23 13:52:57 apollo rnsd[121798]: [2026-08-23 12:12:28] [Warning]  No-outbound return on link packet from BackboneInterface[Client on rns.not-a-number.io/69.30.146.224:53448]
aoû 24 06:23:04 apollo rnsd[121798]: [2026-08-23 12:12:28] [Warning]  No-outbound return on link packet from BackboneInterface[Client on rns.not-a-number.io/69.30.146.224:53448]
aoû 24 06:23:04 apollo systemd[1]: rnsd.service: Main process exited, code=exited, status=255/EXCEPTION
aoû 24 06:23:04 apollo systemd[1]: rnsd.service: Failed with result 'exit-code'.
aoû 24 06:23:04 apollo systemd[1]: rnsd.service: Consumed 4h 59min 8.631s CPU time over 1d 9h 24min 3.256s wall clock time, 405.6M memory peak, 700K read from disk, 2.3G written to disk, 4.7G incoming IP traffic, 5.4G outgoing IP traffic.

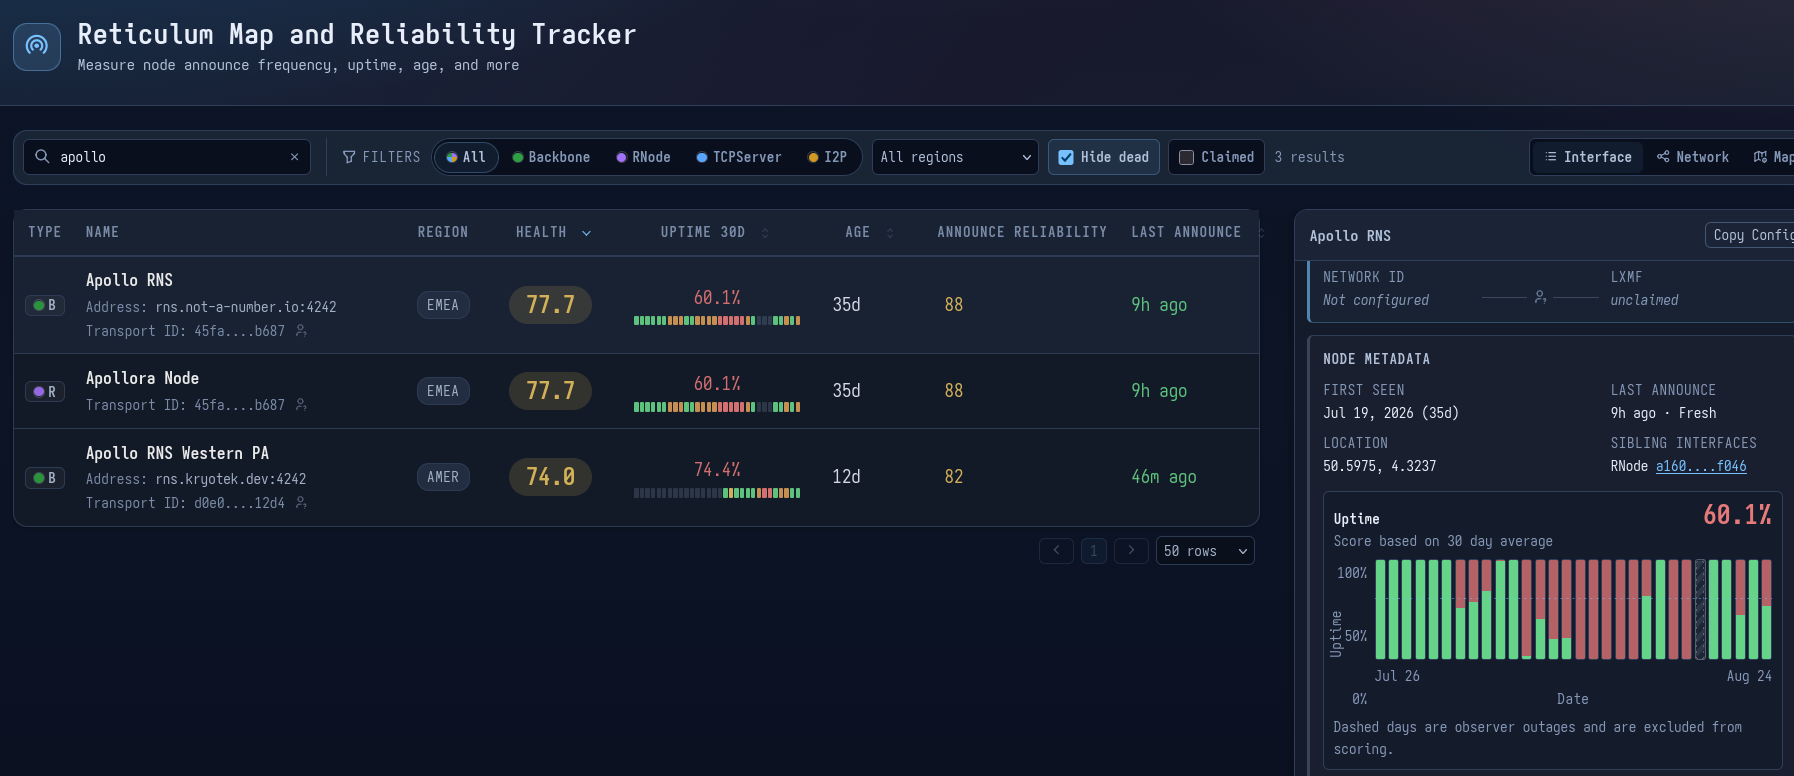
You can see the instability of the server on rns.fyi:

image.png

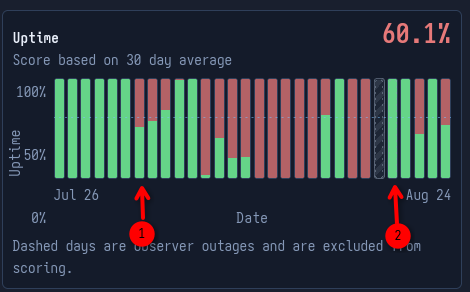
What you can also clearly see is this:

image.png

Before Point 1: very stable service, before version 1.4.2.

Point 1 represent the day I updated the server and switched to version 1.4.2. I was manually watching the server from time to time and restarted it when it was down. At some point I gave up, waiting for the next release.

Point 2 represent the day I updated the server and switch to version 1.5.0. Same pattern unfortunately.

Is there anything I do to help understanding what is going on here ?

K8 8e4525cda4482720...
edited #31

p1ld7a wrote:

Hello,

I have been testing version 1.5.0 on my public node recently. After a few days, I can say that the issue I had with 1.4.2 is still present.

For some reason, the daemon stop working, here's the log of my Apollo RNS node:

[...]

You can see the instability of the server on rns.fyi:

[image]

What you can also clearly see is this:

[image]

Before Point 1: very stable service, before version 1.4.2.

Point 1 represent the day I updated the server and switched to version 1.4.2. I was manually watching the server from time to time and restarted it when it was down. At some point I gave up, waiting for the next release.

Point 2 represent the day I updated the server and switch to version 1.5.0. Same pattern unfortunately.

Is there anything I do to help understanding what is going on here ?

Can you share the logfile from the reticulum config directory after a crash?

K8 8e4525cda4482720...
edited #32

Stats! This is running on 956d688e and the node is currently still stable and responsive. https://pastebin.com/raw/nABJ0uAU

Looks like next_hop_interface does actually see some big spikes after all. There's some more interesting data in there too. Transport._outbound.no_known_path_all is the entire broadcast loop over all interfaces. Transport._outbound.no_known_path_transmit is just the if should_transmit: branch at the end of that loop.

p1ld7a b2e101f8b8d8c776...
#33

K8 wrote:

Can you share the logfile from the reticulum config directory after a crash?

The systemd service is not running with --service flag, so there's no logfile. I will modify the systemd service tonight and restart it with the --service flag. Will keep you posted.

Anonymous
#34

p1ld7a wrote:

K8 wrote:

Can you share the logfile from the reticulum config directory after a crash?

The systemd service is not running with --service flag, so there's no logfile. I will modify the systemd service tonight and restart it with the --service flag. Will keep you posted.

I believe they mean when you manually restart it, before you do you copy the logfile file out. (Why does Reticulum not use file extensions anyway?)

Mark bc7291552be7a58f...
#35

@p1ld7a are you getting any oom-killer messages in your syslog/journal? Looking at the systemd output, I have a suspicion those crashes might be coming from memory exhaustion. How much RAM does the system have?

The queue length defaults are rather high for low-memory devices right now, actually. Especially if you have interfaces with high MTUs.

Mark bc7291552be7a58f...
#36

I've tuned the queue lengths and auto MTU configurations down a bit. My initial estimates at appropriate sizes were honestly waaay too optimistic, and I didn't properly consider the effect on low-RAM nodes. I've tuned this to be much more reasonable now, and the default settings should bound queue memory consumption to 34 megabytes in the default configuration (assuming a backbone interface at the default 100 Mbps rate). All of this is pushed to Aleph, so if you want to have a go at trying it out on your node @p1ld7a, I'd be interested to hear the results.

Mark bc7291552be7a58f...
#37

Good data @K8! There's some very interesting stuff in there, including the path request and next-hop interface spikes, and the handle_tunnel spike is very strange. I assume this is captured the from before Merge branch 'optimize' merge I did last night, right?

Btw, there's now also a (very janky, but functional) transport throughput benchmarker in tests/. Obviously, it's a very synthetic setup with only a few interfaces, so it does not give a full picture of how things look on a live node with 400+ interfaces, but the intention is to be able to get a baseline of the raw transport core packet throughput on various systems. Here's some sample numbers. The direct/drainer numbers are packets per second.

On a decently fast laptop, with hardware accelerated crypto:

scenario                      direct       drainer
----------------------------------------------------------------------
transit_single_475           244,722       159,597     929.94 Mbps / 606.47 Mbps
transit_single_16384          81,574        70,271      10.69 Gbps / 9.21 Gbps
transit_link_475             260,089       224,753     988.34 Mbps / 854.06 Mbps
transit_link_1024            233,364       197,047       1.91 Gbps / 1.61 Gbps
transit_link_16384            83,830        72,889      10.99 Gbps / 9.55 Gbps
transit_link_32768            50,834        48,087      13.33 Gbps / 12.61 Gbps
announce_ingress              12,290        12,166      16.42 Mbps / 16.25 Mbps
outbound_path                862,222             -     931.20 Mbps / -

On the slow, single-core/1G RAM VPS that Bern is running on:

scenario                      direct       drainer
----------------------------------------------------------------------
transit_single_475            77,817        57,980     295.70 Mbps / 220.32 Mbps
transit_single_16384          26,178        18,095       3.43 Gbps / 2.37 Gbps
transit_link_135              79,952        71,570      86.35 Mbps / 77.30 Mbps
transit_link_475              83,273        68,537     316.44 Mbps / 260.44 Mbps
transit_link_1024             70,163        55,815     574.78 Mbps / 457.24 Mbps
transit_link_16384            26,703        18,559       3.50 Gbps / 2.43 Gbps
transit_link_32768            13,211        12,576       3.46 Gbps / 3.30 Gbps
announce_ingress               2,243         2,006       3.00 Mbps / 2.68 Mbps
outbound_path                103,497             -     111.78 Mbps / -
Mark bc7291552be7a58f...
#38

Ok, those text code blocks render weirdly on the web version. They're fine in nomadnet though :)

K8 8e4525cda4482720...
#39

Mark wrote:

Good data @K8! There's some very interesting stuff in there, including the path request and next-hop interface spikes, and the handle_tunnel spike is very strange. I assume this is captured the from before Merge branch 'optimize' merge I did last night, right?

Yeah, those stats are with the IFAC optimizations but not the optimize branch. I just got that pushed to the node, we'll see how it goes.

Also, bwahahaha, maybe this server is a bit shit after all:

------------------------------------------------------------------------
Transport Throughput, median of runs
  scenario                      direct       drainer
  ----------------------------------------------------------------------
  transit_single_135            33,181        22,286      35.84 Mbps / 24.07 Mbps
  transit_single_475            32,692        22,714     124.23 Mbps / 86.31 Mbps
  transit_single_1024           26,358        20,476     215.93 Mbps / 167.74 Mbps
  transit_single_16384           8,902         7,932       1.17 Gbps / 1.04 Gbps
  transit_single_final          31,166        20,131      33.66 Mbps / 21.74 Mbps
  transit_link_135              33,725        22,856      36.42 Mbps / 24.68 Mbps
  transit_link_475              31,449        23,337     119.51 Mbps / 88.68 Mbps
  transit_link_1024             33,203        19,041     272.00 Mbps / 155.98 Mbps
  transit_link_16384             9,505         7,777       1.25 Gbps / 1.02 Gbps
  transit_link_32768             5,551         5,099       1.46 Gbps / 1.34 Gbps
  terminus_single                5,467         4,688       5.90 Mbps / 5.06 Mbps
  announce_ingress               1,549         1,554       2.07 Mbps / 2.08 Mbps
  outbound_path                 49,500             -      53.46 Mbps / -

Compared to my laptop (M4 Pro, should be fast but also won't be using epoll):

------------------------------------------------------------------------
Transport Throughput, median of runs
  scenario                      direct       drainer
  ----------------------------------------------------------------------
  transit_single_135           167,307       123,479     180.69 Mbps / 133.36 Mbps
  transit_single_475           153,314       116,829     582.59 Mbps / 443.95 Mbps
  transit_single_1024          147,699       113,189       1.21 Gbps / 927.25 Mbps
  transit_single_16384          75,494        37,650       9.90 Gbps / 4.93 Gbps
  transit_single_final         157,222       117,739     169.80 Mbps / 127.16 Mbps
  transit_link_135             165,470       122,134     178.71 Mbps / 131.91 Mbps
  transit_link_475             155,451       117,212     590.71 Mbps / 445.41 Mbps
  transit_link_1024            151,818       114,917       1.24 Gbps / 941.40 Mbps
  transit_link_16384            78,048        36,115      10.23 Gbps / 4.73 Gbps
  transit_link_32768            49,320        34,483      12.93 Gbps / 9.04 Gbps
  terminus_single               30,107        28,772      32.52 Mbps / 31.07 Mbps
  announce_ingress               7,539         7,477      10.07 Mbps / 9.99 Mbps
  outbound_path                401,622             -     433.75 Mbps / -

4 cores and they're all sad 😂.

Post a Reply

Supports Markdown: **bold**, *italic*, `code`, ```code blocks```, [links](url)

Log in to upload images

Quote
Copied to clipboard